Site & Soil (Individual)
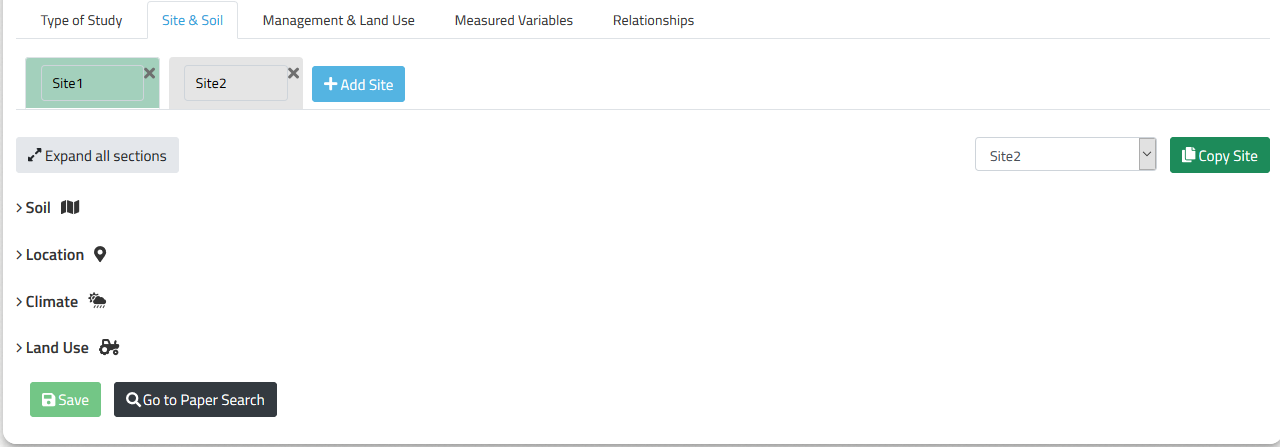
The “Site & Soil” page collects all information on the sites, where the experiments for the study were conducted. The page is organized as tabs, with one tab for each site. The default “Site & Soil” page starts with one site. New sites can be easily added using the blue button. The active site is always marked in green, inactive sites are grey. The data from any existing site can be copied to the active site by using the green button on the right side. The site to copy from is selected in the drop down menu. All site names can be edited by clicking on their name.

Each site-tab contains four subcategories, Soil, Location, Climate, and Land Use, which are all expandable.
Soil
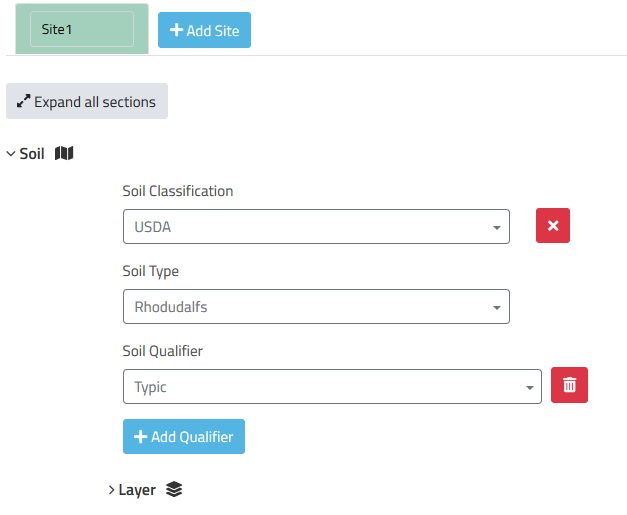
The soil subcategory collects information on soil classification, soil type, and soil layers. You can select from four soil classifications, USDA, WRB, FAO, and German soil classification. Depending on your choice classification specific soil types and additional corresponding soil qualifiers and specifiers can be selected. The available qualifiers and specifiers depend on the soil type. Not all qualifiers and specifiers are available for each soil type. Qualifiers and specifiers can be added or removed using the respective buttons.

Layers
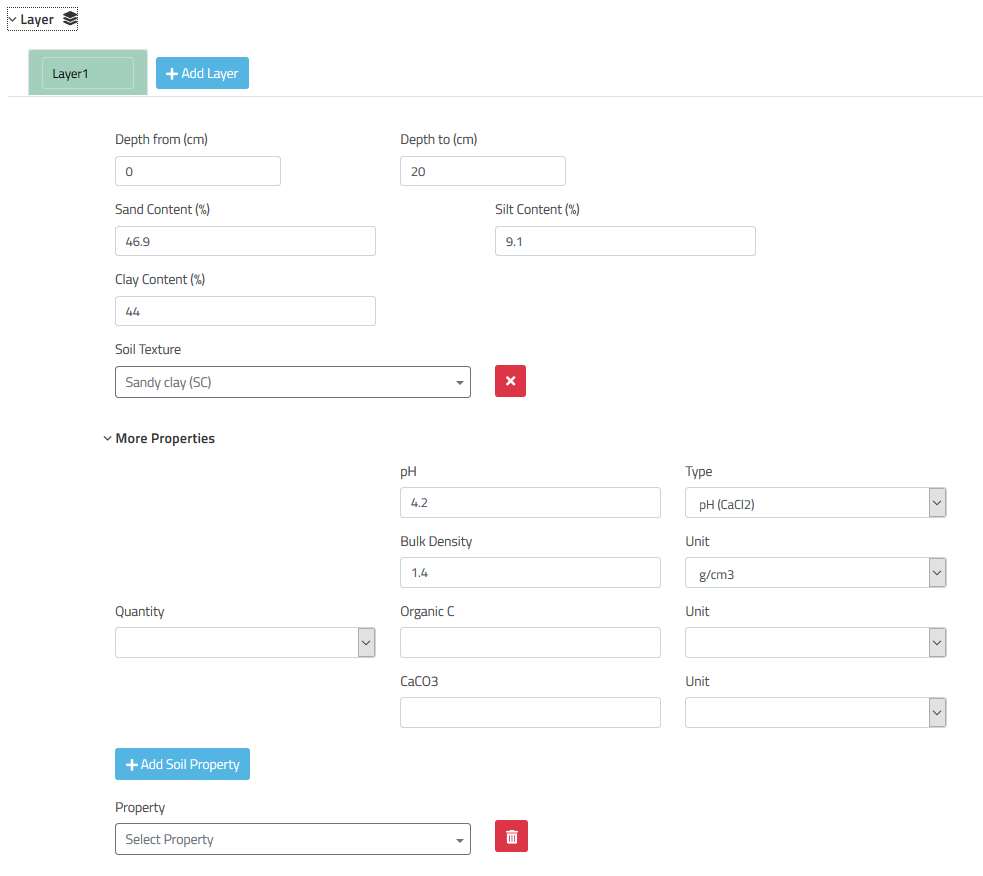
The layer subsubcategory collects all information on measured soil specific properties, which were static during the experiment. Hence, here belong the soil descriptions from the materials & methods part of an article. The layers are organized as tabs, just like the sites, with one tab for each layer. Hence, each soil layer depicted in the article can be added as one layer-tab. By default there is one layer-tab. If you want to enter soil properties for the whole soil profile, just leave it at one layer and enter your values there. All layer names can be edited, if necessary. Both soil and layer names are mainly for personal orientation and won’t be used for geotagging!
Additional Properties
“Depth from” and “depth to” describe the upper and lower boundaries of the soil layer these property values were taken from. Besides textural properties other standard properties can be found under “more properties”. Do not forget to enter units and a quantity, if applicable. Soil texture is automatically calculated from sand, silt, and clay contents depending on the soil classification selected. More, not so standard, properties can be manually added using the respective button.

Location
Latitude and longitude can be entered to specify the location of the site. Polar and decimal coordinate values are accepted. In case the coordinates are not specified in the article you can paste a name, e.g. city, region, administrative entity, common name into the search field and hit the “find” button. If the name exists in the database of OpenStreetMap, the coordinates are filled in automatically. If the name wasn’t found try some alternative names for the location!

Climate
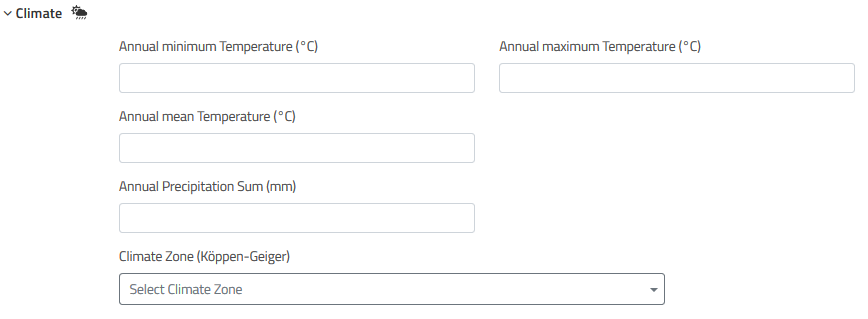
Minimum, maximum, mean annual temperature and annual precipitation sum as climatological boundary conditions for the site can be entered here. Additionally, the Köppen-Geiger climate class can be entered, if available.

Land Use
We want to collect information on long term constant land use and management practices. If land use and/or management practices changed over the course of the study and are subject to statistical analyses, they should be entered on the “Management & Land Use” tab.
As land uses the classes from the Corine land cover nomenclature present the vocabulary available. If one or more crop rotations were used during the study, they have to be created using the “Crop rotation generator” here and can be added as a long term management practice. The crop rotation can be created by simply adding crop to the rotation and saving, when the result is satisfying. The rotation can later be used in the “Management & Land Use” tab.
