Property relations
Property relations
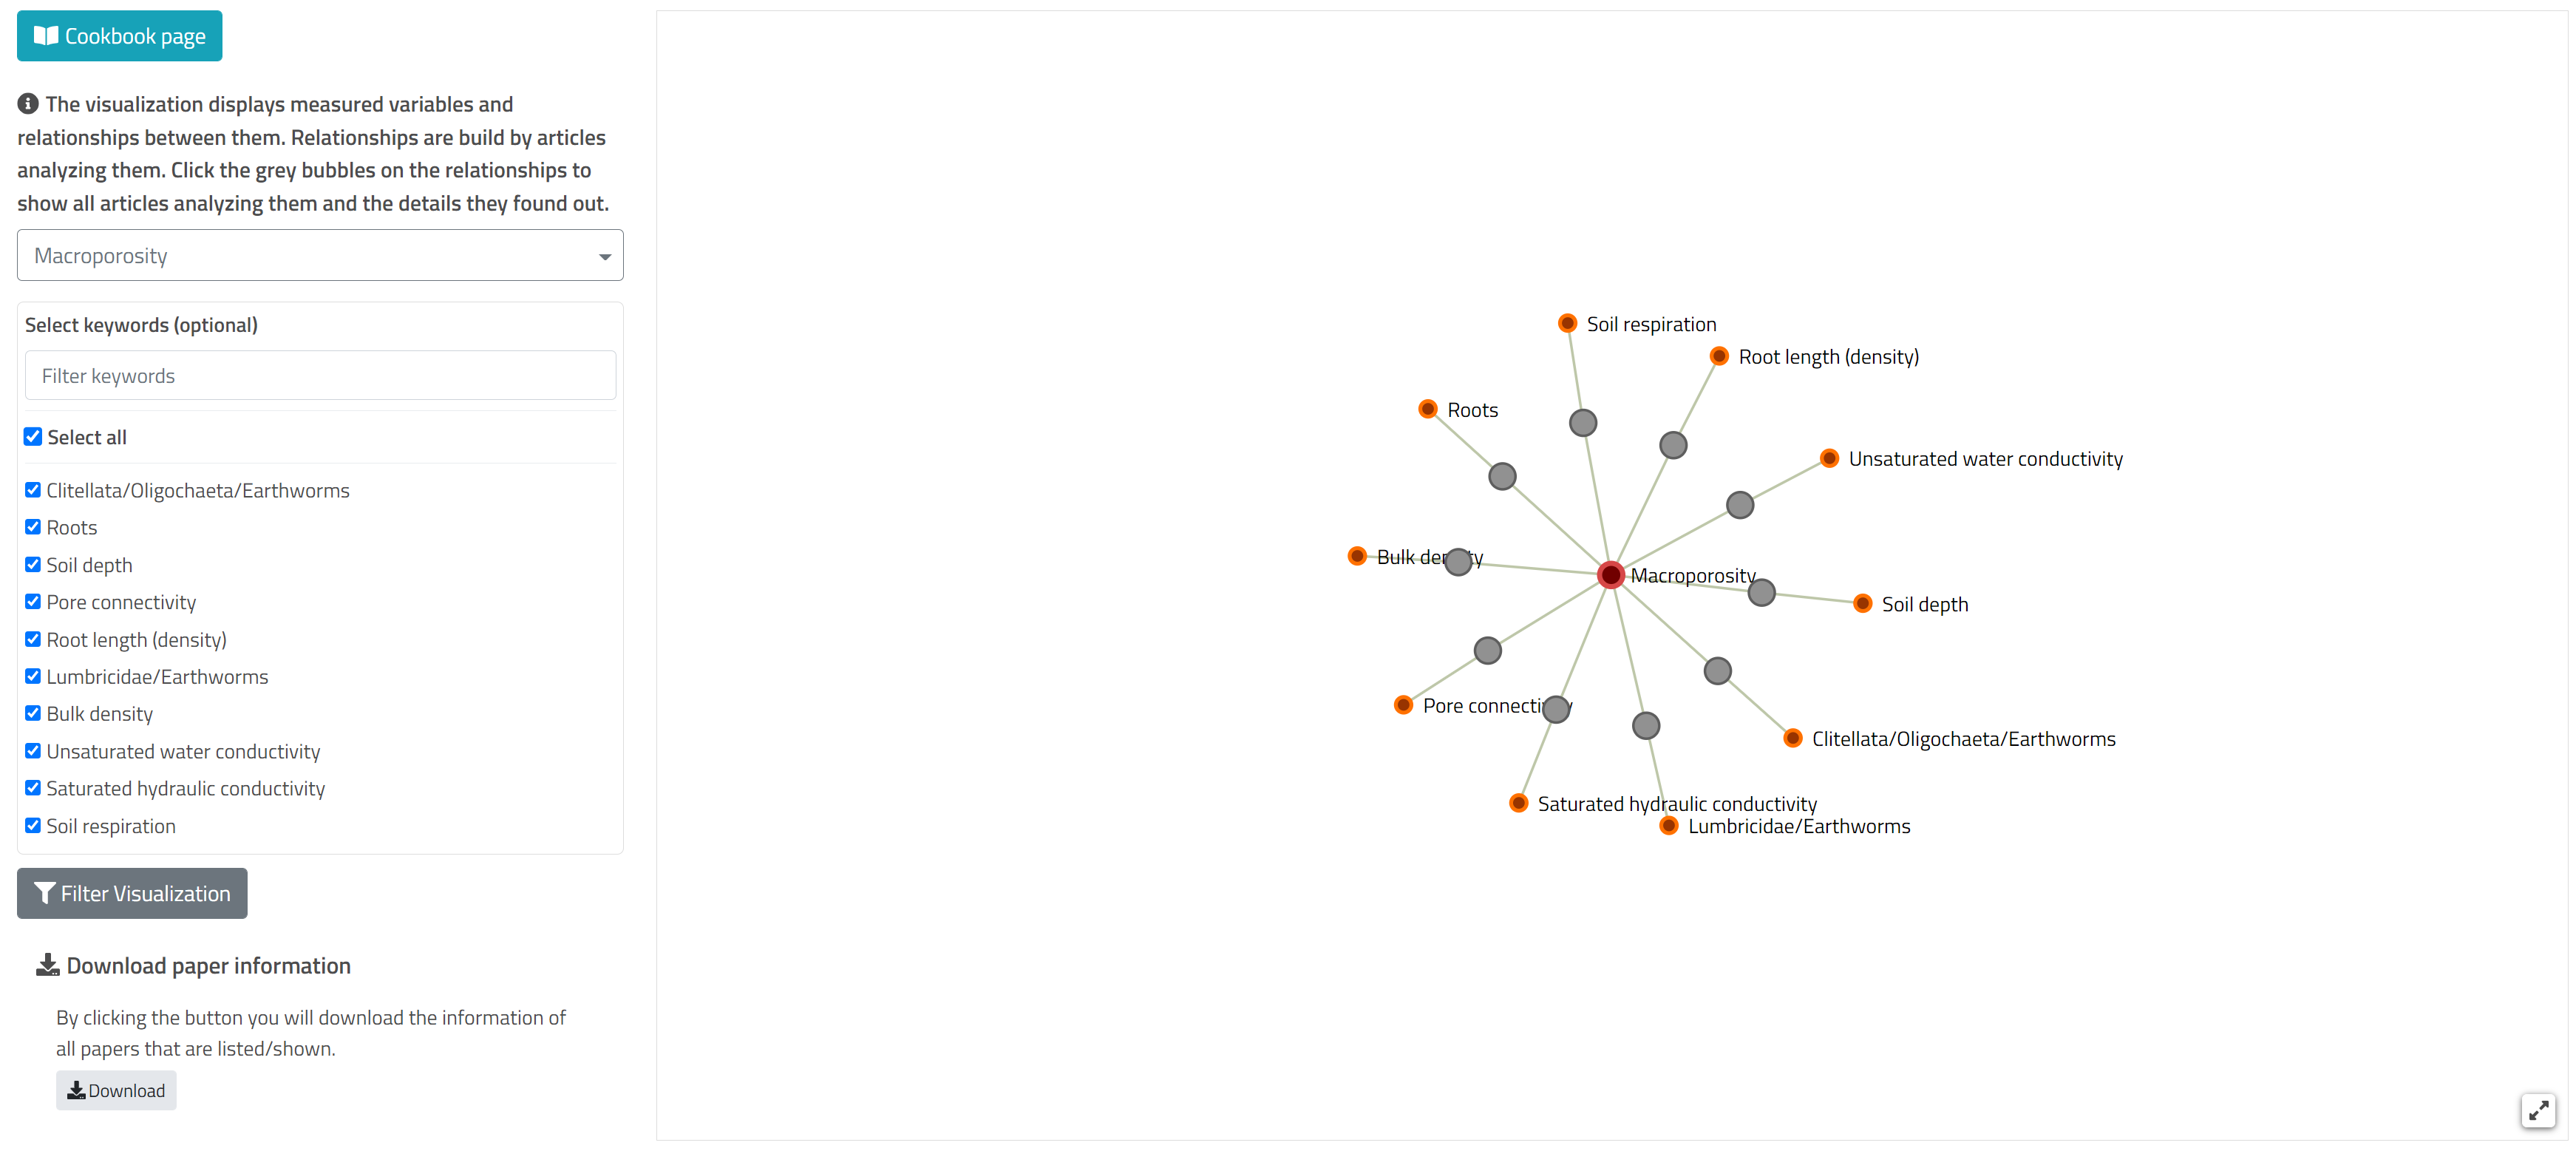
The property relations visualization displays measured variables and relationships between them. First, select the measured variable you are interested in, from the dropdown menu. All soil properties having a relationship with the selected variable in the Klib are shown and connected with it. You can filter the connecting properties by using the checkmarks on the left side.
The grey bubbles between keywords are clickable and show a list of articles dealing with exactly this relationship. The type of relationship for each article is presented left of the title. Above the search field a statistic shows the cumulative number of relationships for each type. By using the checkmarks besides each relationship type you can filter the articles for a specific type. Further exploring options are a text search field, the article overview and a link to the paper-centered visualization, similar to the starting page.
The filter function is explained on this page and the download function is explained on this page.

Symbols can be dragged around by left clicking and the visualization can be zoomed in and out using the mouse wheel to get a better overview. The visualization can be displayed in fullscreen mode using the arrows in the lower right corner.