Filter visualizations
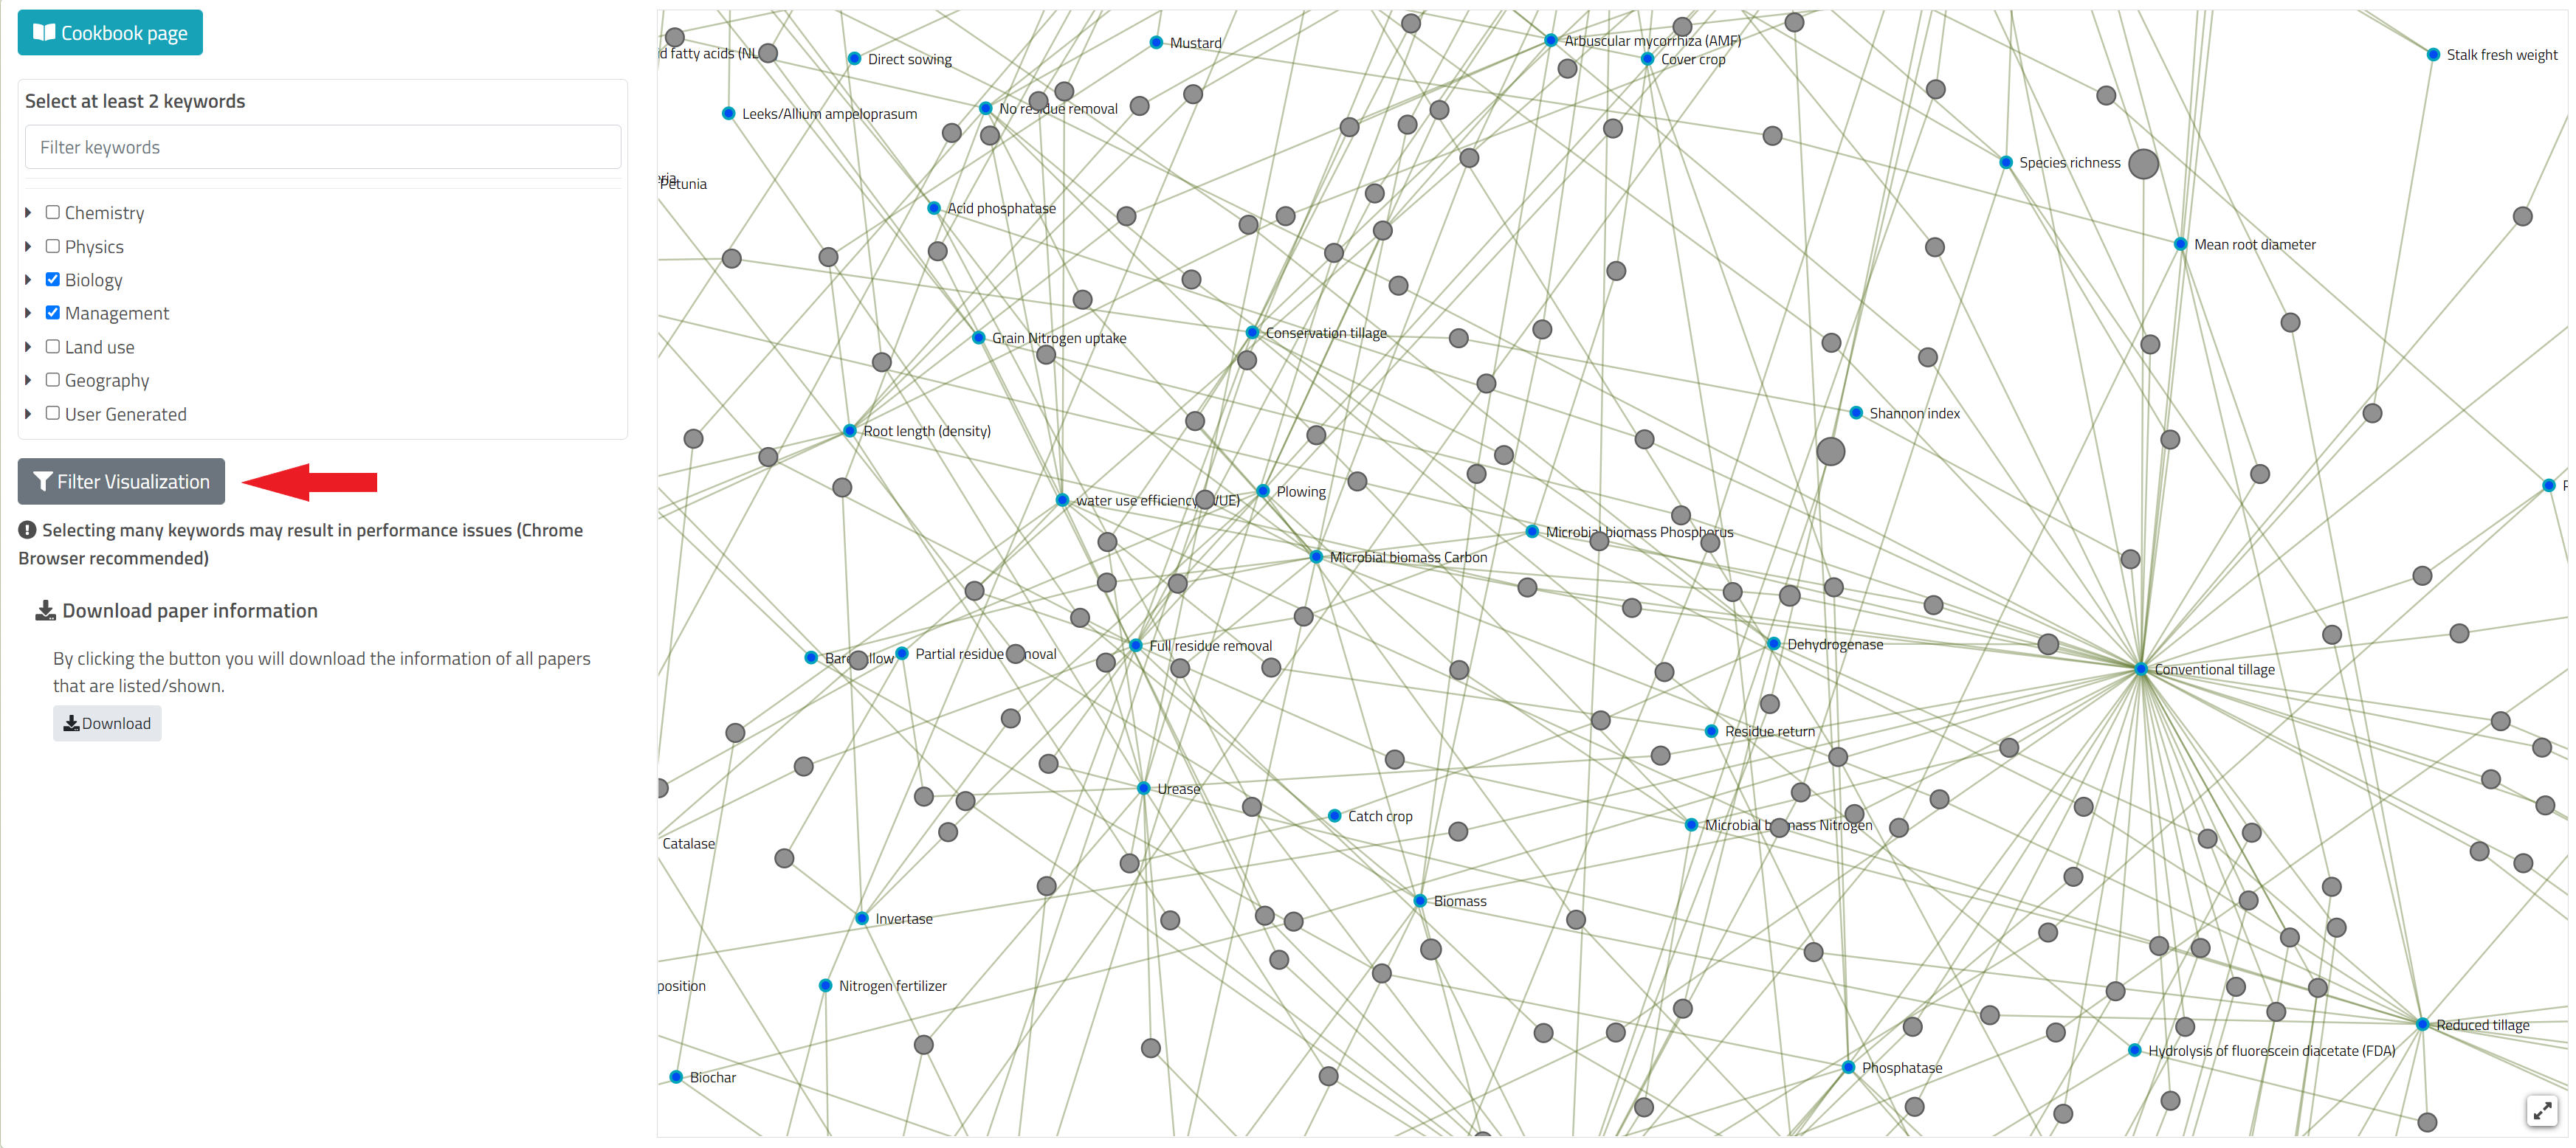
You can filter nearly all visualizations for some values or categories to get a more detailed view on specific articles and their relationship. The filter function can be found by clicking the button in the visualization.

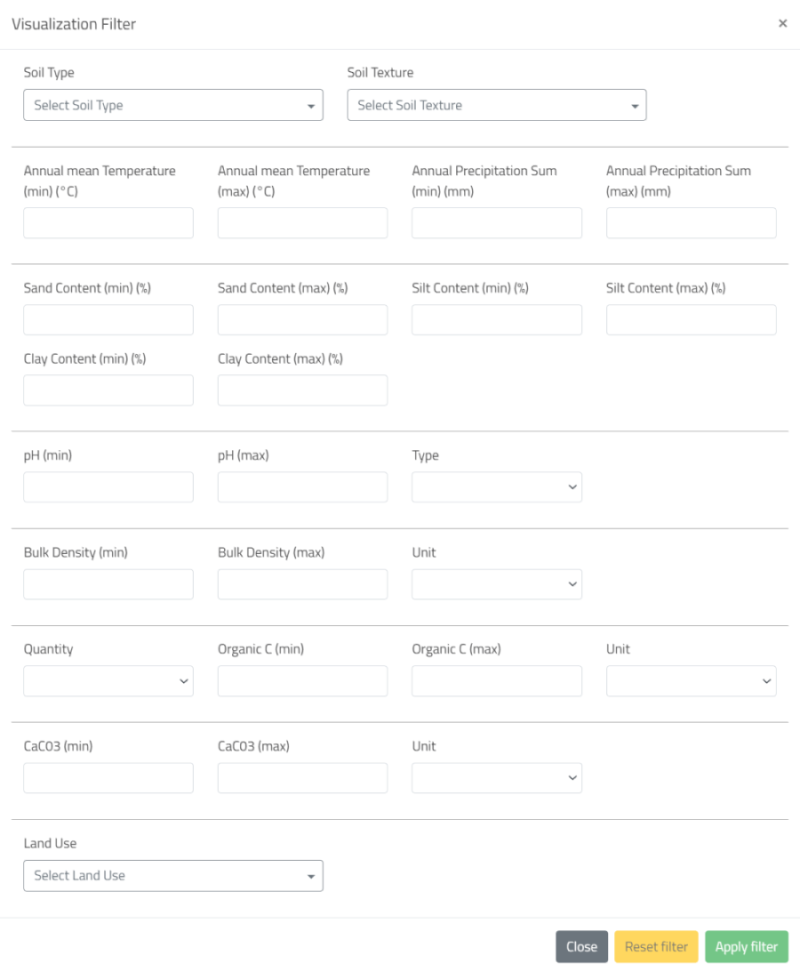
In the opening window you can enter some parameters to get a more detailed look on some papers. For example defining a specific range of soil temperature etc. By clicking the apply filter button all the articles that are visualized are filtered depending on your entered filters. You can also reset all to start a new filter or view the original state of the visualization.
