Comparison of drivers
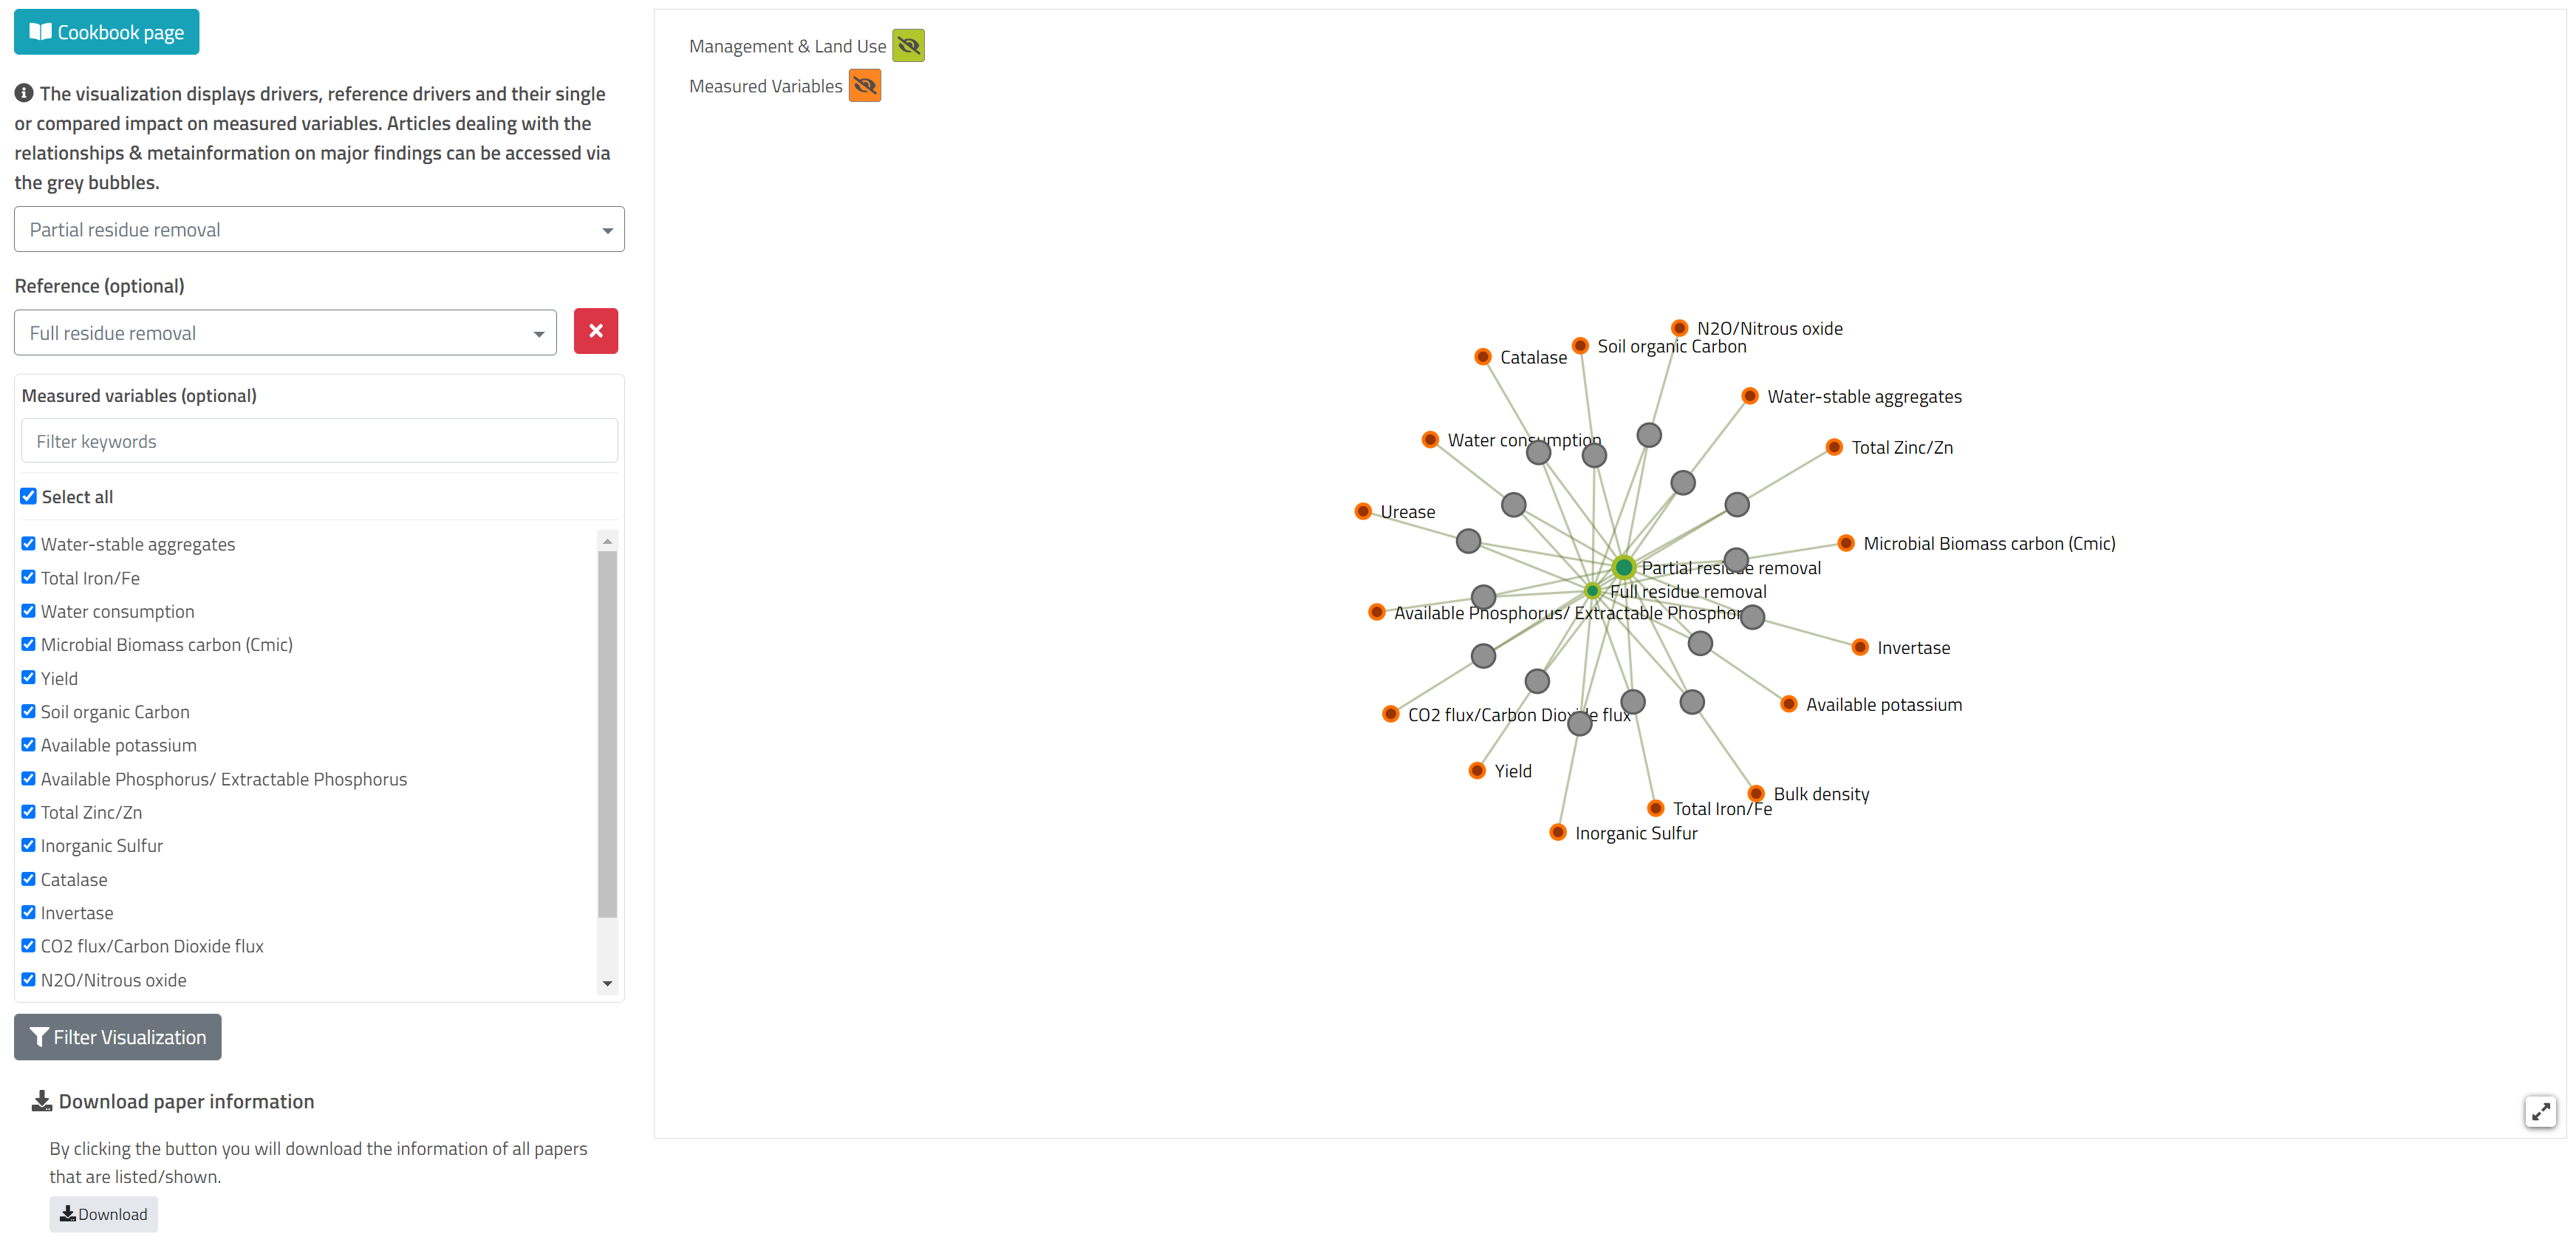
This visualization displays drivers and their impact on measured variables. The relationship between the main driver (big green dot) and a measured variable (orange dot) is depicted by a line connecting them. The articles dealing with the relationship & metainformation on major findings can be accessed via the grey bubbles. In addition the reference drivers (small green dots; drivers the main driver was compared with during studies) are connected to the grey bubbles. Exactly one grey bubble exists for each driver-reference-variable-combination.
In addition you can specify a reference to filter for one specific driver-reference-combination and filter the measured variables by using the checkboxes.
The filter function is explained on this page and the download function is explained on this page.
