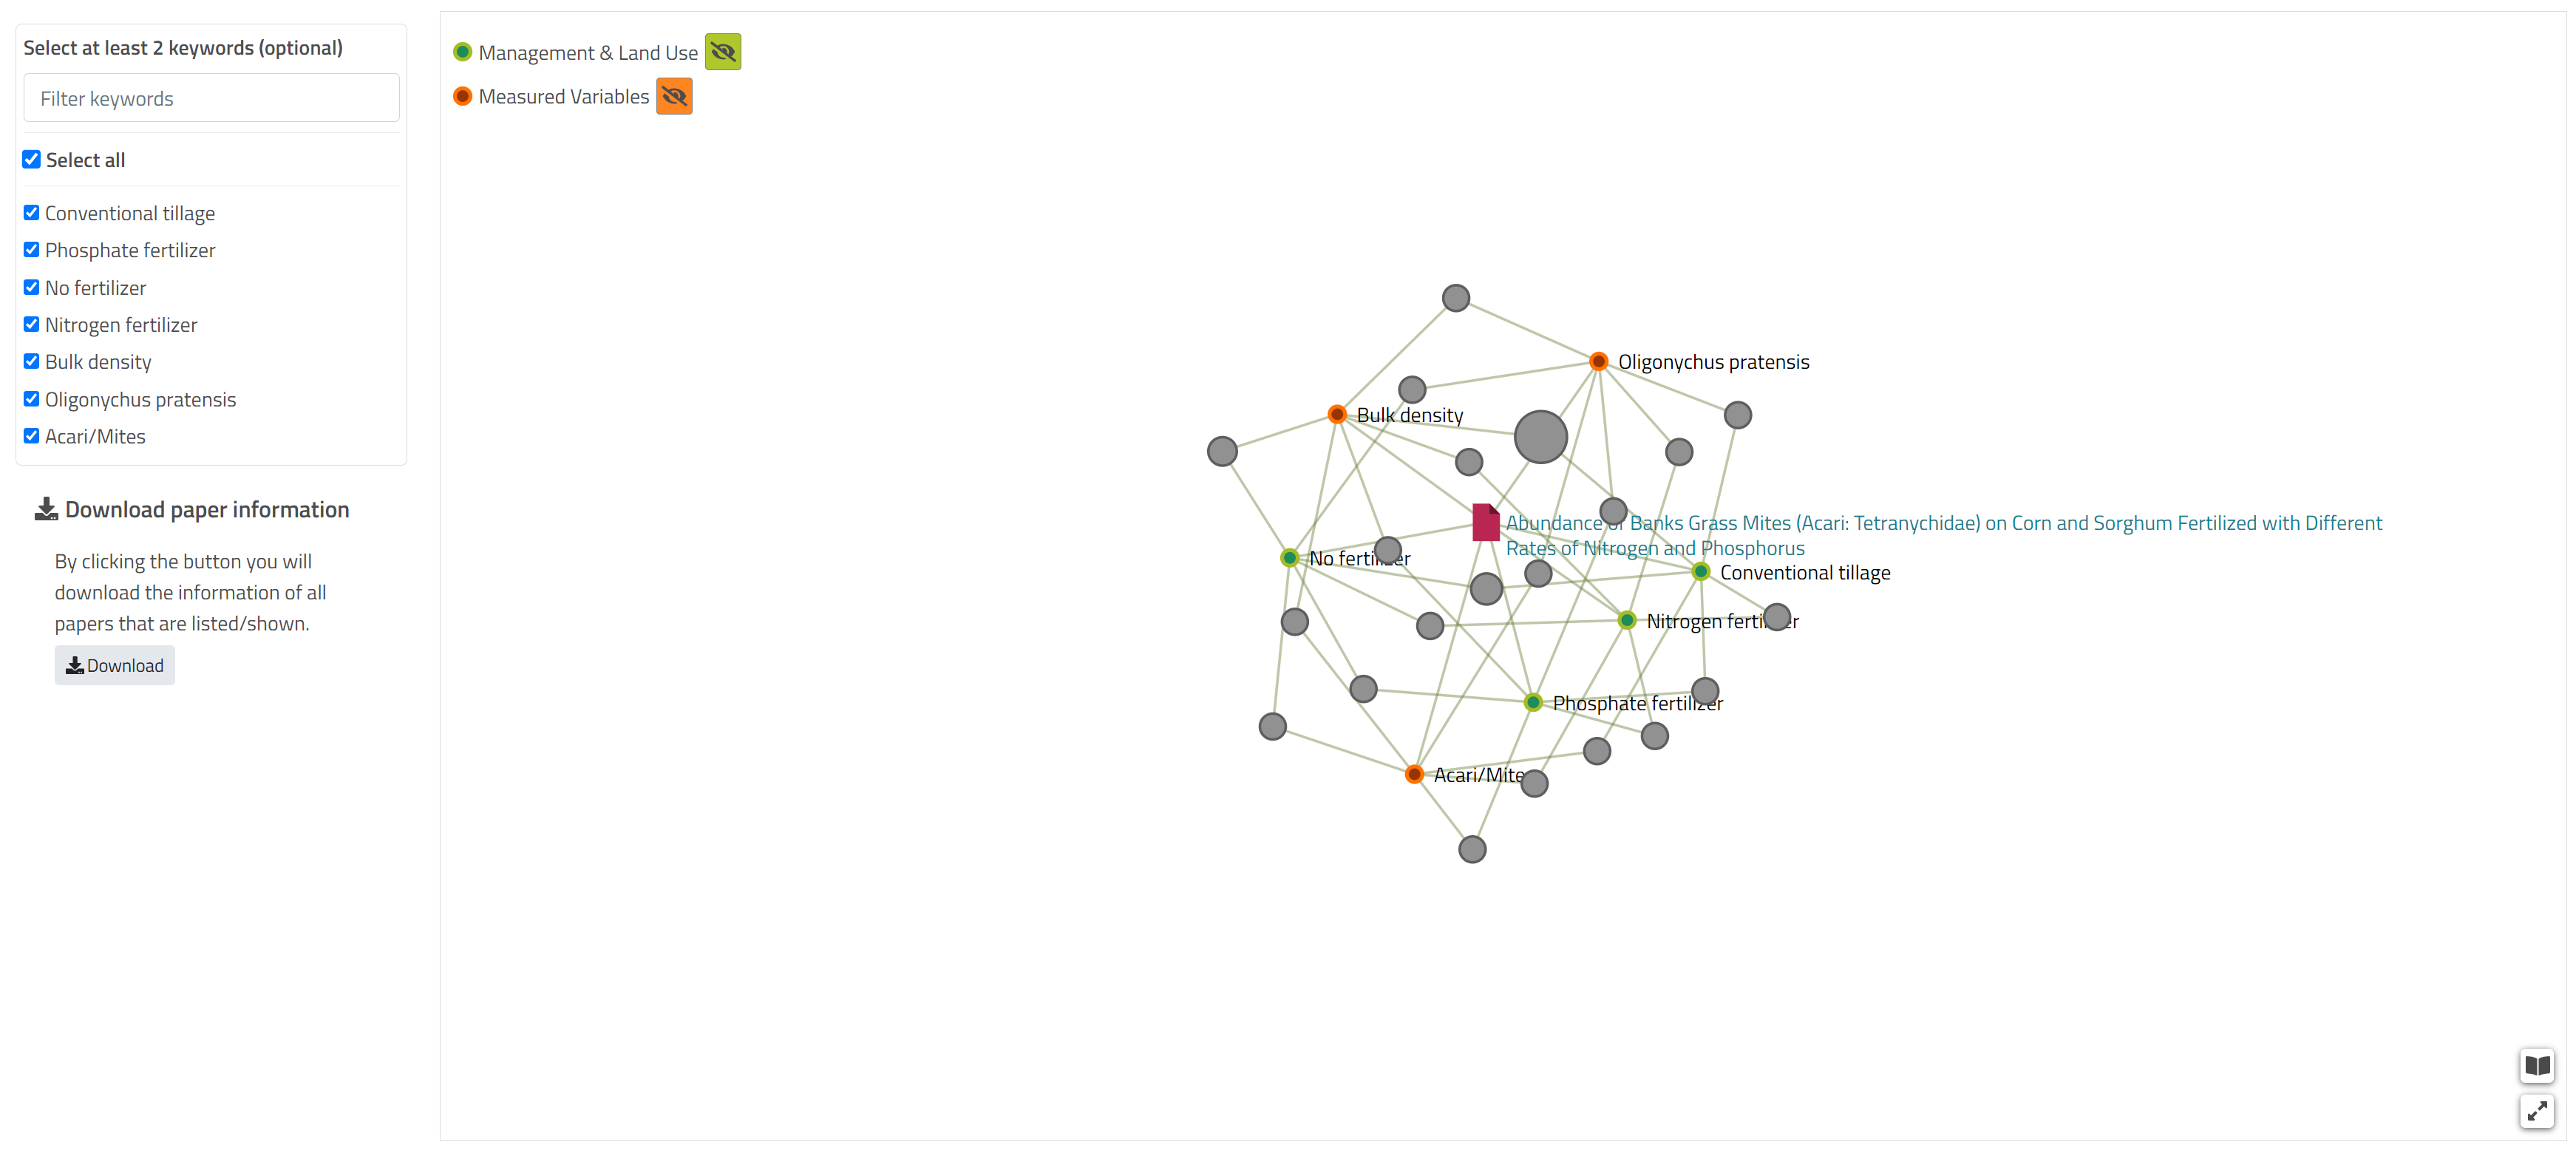
Paper-centered visualization
This visualization can be accessed by a button on the right side of each article. Depending on the soil properties, management practices and land uses entered the article gets connected to articles sharing at least two of the elements mentioned.
The download function is explained on this page

Graphical properties can be changed using the symbols in the upper left corner. The grey bubbles between keywords are clickable and show a list of articles dealing with exactly these two keywords. Symbols can be dragged around by left clicking and the visualization can be zoomed in and out using the mouse wheel to get a better overview. The shown keywords can be filtered by using the checkmarks on the left side. You can download all articles that are visualized by clicking the download button on the left side.