Map application
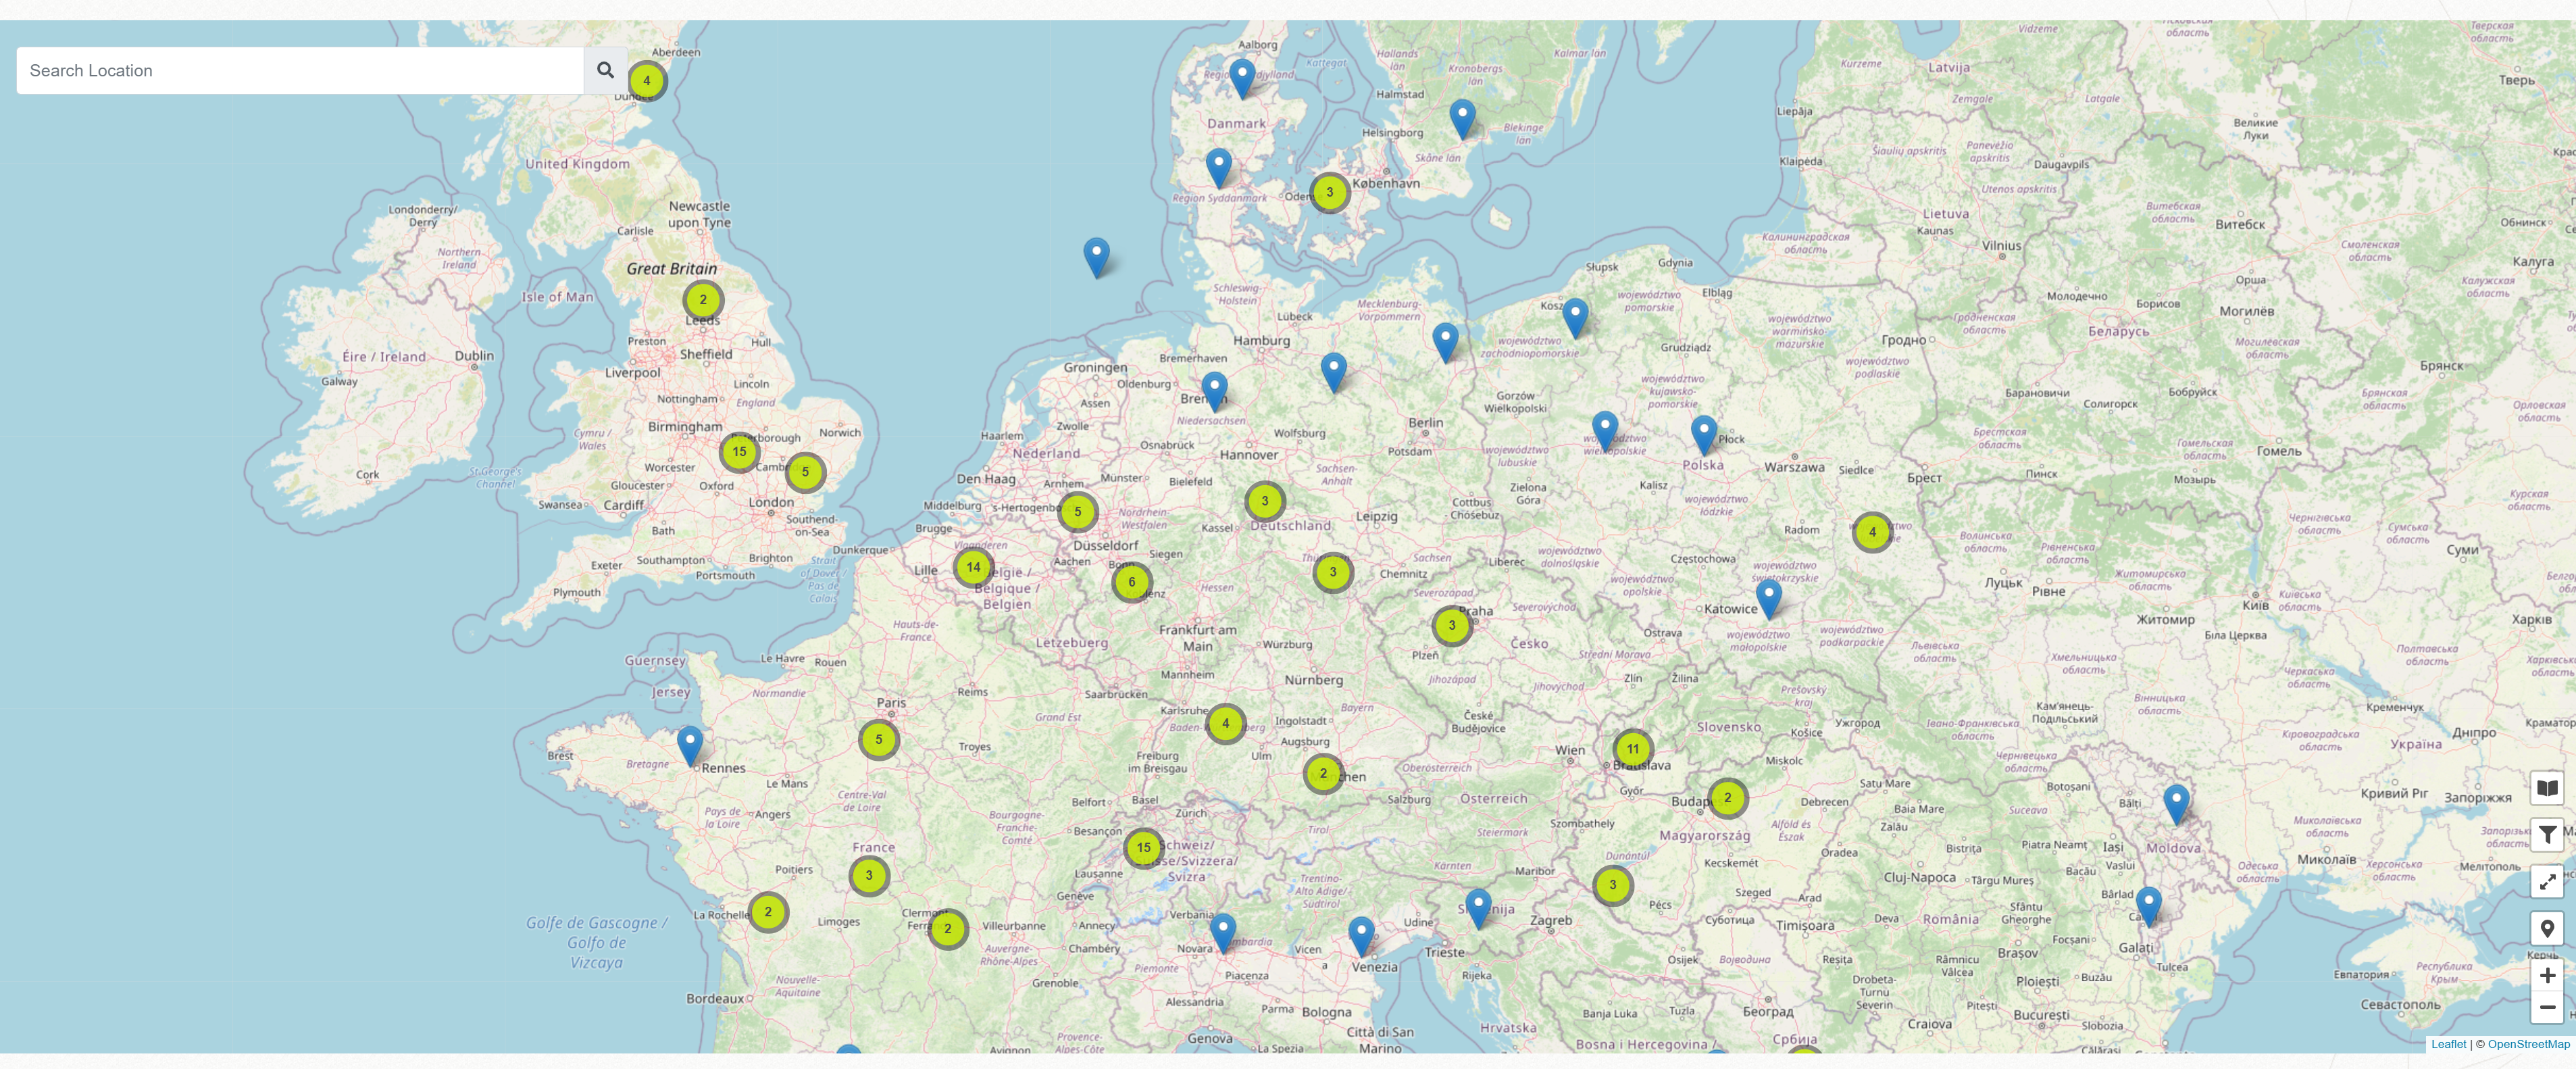
This visualization displays all articles in the Klib, which have coordinates attached.
Green circles with numbers indicate the number of articles in this region. The circles split into multiple blue flags, when zoomed in. Clicking on the blue symbols displays the overview of the respective article.
Please use the text field in the upper left corner to search for specific locations.
You can zoom in and out using the mouse wheel to get a better overview. The visualization can be displayed in fullscreen mode using the arrows in the lower right corner.
The filter function is explained on this page.
